TL;DR
When I test feature that involve time, depicted graph helps me to understand that feature.
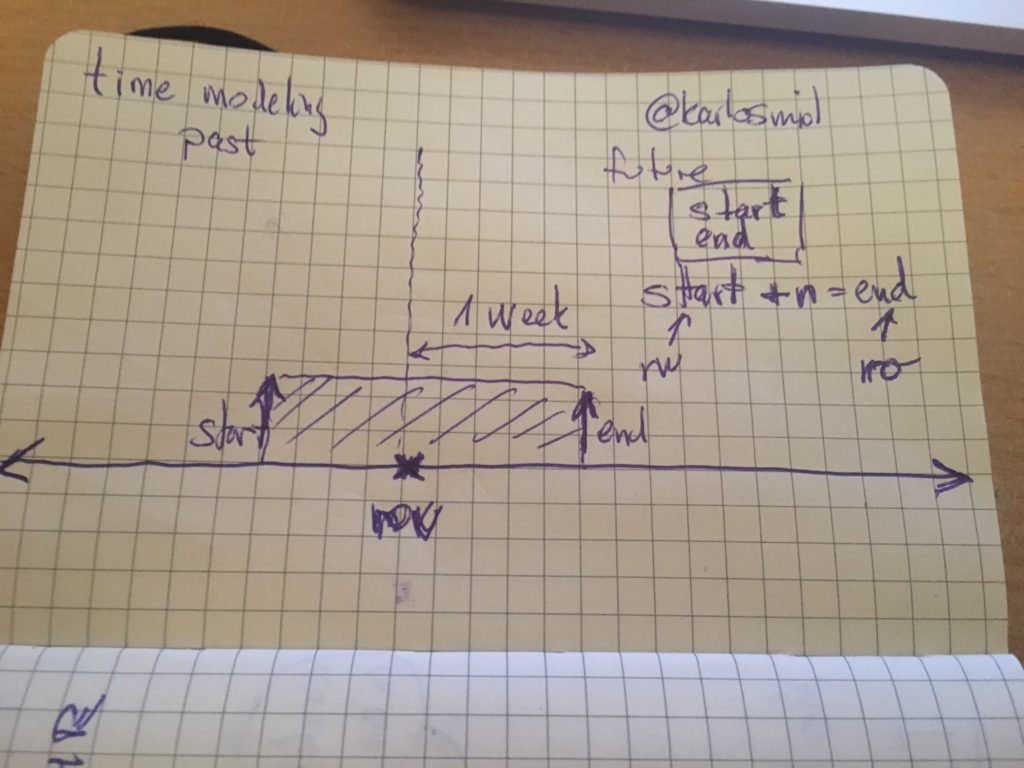
I found features that involve time tricky to test because time is abstract attribute and I can not put my hands on it. What helps me to grasp time into my head is graph that models it. Here is one example. There is event that has start and end time.
start + x_month = end
Only start could be updated, end is calculated based on previous function. I need to test email that is send when event end is in one week.
Can you model this in your hand? Following picture helped me:

With that graph in front of me, I can do time tour. In order to trigger email, end time must be in one week. With basic mathematics:
start = end - x_month

start = 1.week.from_now - x_month
Lets take that x_month is 3 and now is Sat. Apr 21st 2018
start = now + 1.week - 3.months (note that this is pseudocode)
Guess what, date arithmetic is tricky :). Leap years and different number of days in month make tester job harder.
Lets see what my favourite web framework, Ruby on rails, has to offer. Lets run rails console:
rails c

[13] pry(main)> 1.week.from_now
=> Sat, 28 Apr 2018 15:10:53 EDT -04:00

[24] pry(main)> 1.week.from_now - 3.month
=> Sun, 28 Jan 2018 15:17:15 EST -05:00
Start date is Sun, 28 Jan 2018!
Rails has excellent helper functions that could help in date calculations. Ask your developer does web framework in your project has something like that. Modeling is used for depicting abstract stuff, and time is perfect candidate for modelling.


